
Railway Wheel Wear Rate Data: What Signals Risk?

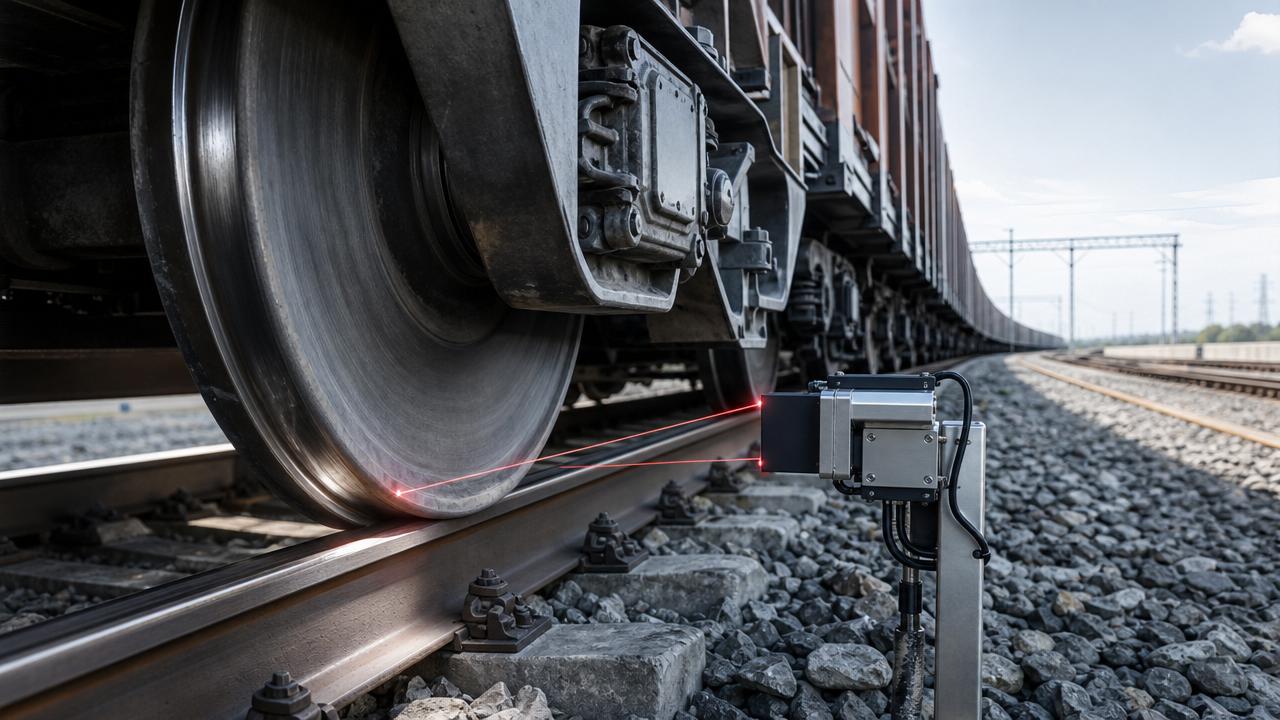
Railway Wheel Wear Rate Data: What Signals Risk?
For quality control and safety teams, railway wheel wear rate data is more than a maintenance metric.
It is an early warning system for derailment risk, asset fatigue, and hidden wheel-rail interface problems.
When wear accelerates or deviates from expected limits, it can signal loading, braking, alignment, metallurgy, or operating-condition issues.
Understanding railway wheel wear rate data helps teams move from reactive inspection to risk-based decisions across heavy freight corridors.
Why Railway Wheel Wear Rate Data Is Becoming a Strategic Safety Signal
Freight rail networks are carrying heavier axle loads, longer train formations, and tighter delivery schedules.
These pressures make railway wheel wear rate data increasingly important for asset planning and corridor safety.
Traditional wheel inspections identify visible damage, but they may miss the trend behind repeated defects.
Wear rate analysis reveals whether a wheelset is degrading normally or entering a risk zone.
The shift is clear: rail organizations are moving from calendar-based maintenance to condition-based maintenance.
In that model, railway wheel wear rate data becomes a practical link between inspection records, wayside detection, and operating discipline.
It also supports compliance with UIC, EN, AAR, and internal safety thresholds.
Current Trend Signals Behind Faster Wheel Wear
Wheel wear is not only a component issue. It reflects a changing operating environment.
Higher freight density, more mixed traffic, and variable track conditions create sharper differences between expected and observed wear rates.
Railway wheel wear rate data often exposes problems before vibration, noise, or thermal alarms become obvious.
A sudden rise in flange wear may indicate curve negotiation problems, poor lubrication, or bogie steering defects.
A rapid tread hollowing trend may suggest braking imbalance, wheel slide, or unfavorable rail profile contact.
Uneven wear between paired wheels can point to suspension faults, loading bias, or wheelset assembly issues.
These signals matter because wheel degradation rarely occurs in isolation.
The strongest insights come when railway wheel wear rate data is compared with route, speed, load, brake, and track geometry data.
What Drives Abnormal Railway Wheel Wear Rate Data?
The causes of abnormal wear are usually multi-factor. A single reading rarely explains the full risk.
Trend interpretation should combine mechanical, operational, environmental, and material factors.
This structure prevents overreaction to one measurement while still highlighting emerging hazards.
Railway wheel wear rate data becomes valuable when it is benchmarked against route-specific and fleet-specific baselines.
Key Measurements That Turn Wear Data Into Risk Intelligence
Not every measurement carries the same safety meaning. The most useful indicators show both condition and rate of change.
- Flange thickness trend, especially rapid reduction over a short service interval.
- Flange height increase, which may indicate tread wear and profile distortion.
- Tread hollowing depth, linked to contact instability and braking effects.
- Wheel diameter difference across axle, bogie, wagon, or locomotive groups.
- Rolling contact fatigue marks, including spalling, shelling, and surface cracking.
- Thermal discoloration or flat spots associated with braking or wheel slide events.
Railway wheel wear rate data should also include mileage, tonnage, route class, and reprofiling history.
Without those context fields, a high wear number may be misleading.
A heavily loaded mountain route should not be compared directly with a flat intermodal corridor.
The best practice is to normalize railway wheel wear rate data by distance, gross tonnage, and operating pattern.
How Wear Patterns Affect Rolling Stock, Track, and Corridor Reliability
Accelerated wheel wear creates direct and indirect consequences across the rail system.
At rolling stock level, it increases reprofiling frequency, wheelset replacement costs, and depot workload.
At track level, poor wheel profiles can raise lateral forces, worsen rail wear, and accelerate turnout damage.
At corridor level, unmanaged railway wheel wear rate data can translate into speed restrictions, failures, and service unreliability.
For heavy-haul freight, the compounding effect is significant.
One abnormal wagon may influence train dynamics, brake performance, and wheel-rail forces across a long consist.
For locomotives, wear imbalance can affect traction efficiency, ride stability, and component stress.
For engineering teams, railway wheel wear rate data supports prioritization when budgets and track access are limited.
Risk Thresholds: When Does Railway Wheel Wear Rate Data Require Action?
A single absolute threshold is not enough. Risk depends on trend speed, fleet baseline, route severity, and safety margins.
However, several patterns deserve immediate review.
- Wear rate doubles compared with the same asset family and route group.
- Paired wheels show widening diameter or profile differences.
- Flange wear rises after a route change or track maintenance intervention.
- Tread defects repeat after reprofiling within a short service interval.
- Wayside sensors show thermal, impact, or acoustic anomalies on the same wheelset.
These conditions do not automatically confirm failure. They indicate that the risk model needs escalation.
In practice, railway wheel wear rate data should trigger staged responses, not only emergency removal.
From Inspection Records to Predictive Maintenance Decisions
The value of railway wheel wear rate data increases when inspection records are digitized and standardized.
Manual notes, depot records, and wayside detector feeds should use consistent wheelset identifiers.
This enables trend comparison over time, not only point-in-time judgment.
Predictive models can then estimate remaining wheel life, expected reprofiling windows, and abnormal degradation probability.
The model does not need to be complex at the beginning.
A reliable baseline, clean measurements, and clear exception rules can deliver immediate improvement.
Over time, railway wheel wear rate data can be integrated with ETCS logs, braking events, loading systems, and track geometry cars.
This creates a stronger view of cause, not only consequence.
Practical Focus Areas for Better Wear Trend Control
Several focus areas help convert wheel wear monitoring into practical safety control.
- Build route-specific baselines for wheel wear, not only fleet-wide averages.
- Separate locomotive, wagon, axle-load, and commodity categories.
- Track post-reprofiling performance to identify recurring root causes.
- Compare wheel wear with rail lubrication, curve density, and grade profile.
- Link impact load detector alerts with physical wheel measurements.
- Audit measurement tools and inspection methods for repeatability.
Railway wheel wear rate data must remain traceable from measurement to decision.
If thresholds are unclear, teams may either over-maintain assets or miss safety-critical changes.
Recommended Response Logic for Different Risk Levels
A tiered response helps balance safety, uptime, and maintenance capacity.
This approach keeps railway wheel wear rate data connected to operational reality.
It also supports defensible decisions during audits, incident reviews, and maintenance planning cycles.
What to Watch Next in Wheel Wear Analytics
The next stage of wheel wear analytics will rely on richer data fusion.
Wayside monitoring, onboard diagnostics, digital maintenance records, and track condition data will become more closely connected.
Artificial intelligence may help classify wear patterns, but data discipline remains the foundation.
Poor input quality will produce weak predictions, even with advanced algorithms.
The most useful railway wheel wear rate data will be standardized, time-stamped, route-linked, and validated against physical inspection.
This direction aligns with broader freight rail modernization, including smart signaling, high-capacity corridors, and low-carbon logistics.
For integrated rail systems, wheel wear is no longer only a depot issue.
It is a network reliability indicator that connects rolling stock, infrastructure, safety management, and commercial performance.
Action Path: Turning Railway Wheel Wear Rate Data Into Safer Decisions
Start by defining what normal wear looks like for each route and asset group.
Then establish exception thresholds that reflect operating context, safety rules, and maintenance capacity.
Next, connect railway wheel wear rate data with braking records, load data, track geometry, and wayside alarms.
Finally, review abnormal trends through a cross-functional engineering lens before selecting the response.
The goal is not to collect more numbers. The goal is to detect risk earlier and act with confidence.
When railway wheel wear rate data is structured, benchmarked, and acted on, it becomes a strategic safety asset.
For modern freight corridors, that capability protects wheels, rails, schedules, and the steel arteries of global trade.
- Using Railway Wheel Wear Data to Plan Reprofiling and Reduce Lifecycle RiskTime : Oct 12, 2026
- How to Select Track Maintenance Equipment for Rail Defects, Geometry, and Access LimitsTime : Sep 29, 2026
- A Practical Framework for Railway Technical Intelligence Analysis in Asset PlanningTime : Sep 19, 2026
Industry Briefing
Get the top 5 industry headlines delivered to your inbox every morning.