
Economic Indicators That Signal Rail Freight Demand Shifts

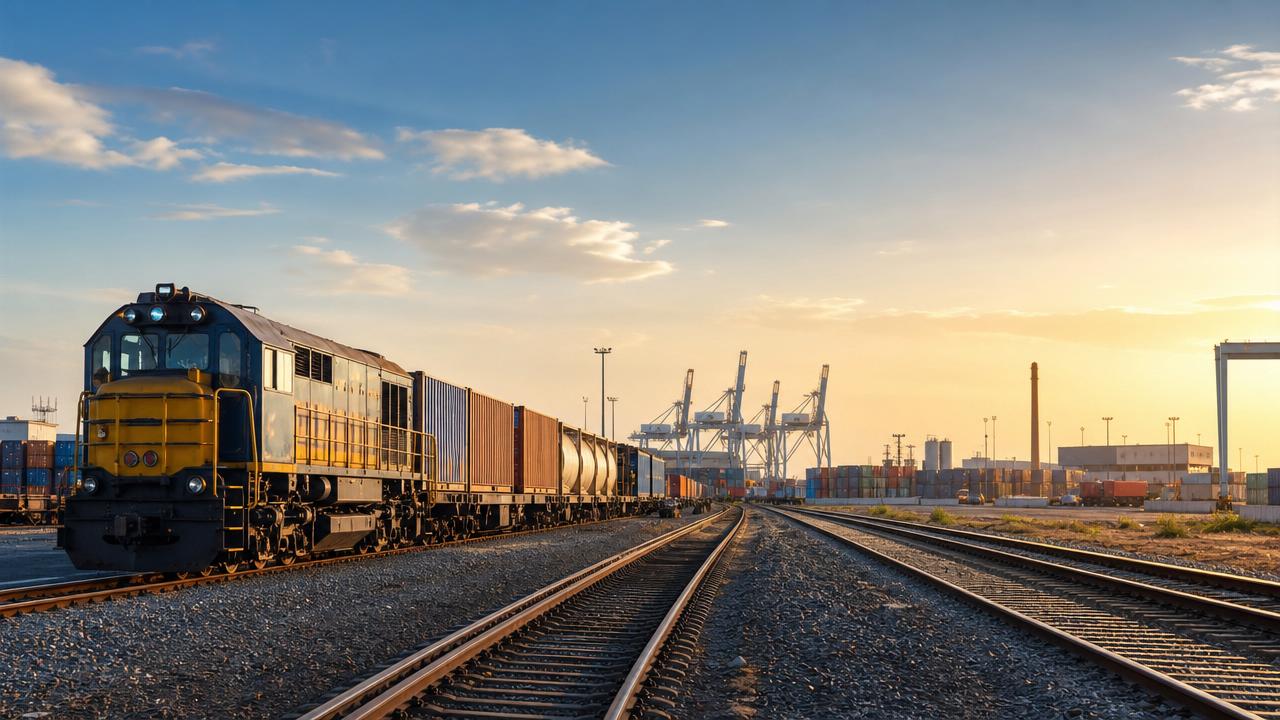
Rail freight demand rarely shifts without warning; it is often foreshadowed by measurable economic indicators that reveal changes in production, trade flows, inventory cycles, and infrastructure investment.
For business evaluators, these signals support decisions on capacity, corridor profitability, rolling stock utilization, and long-term logistics risk across global supply chains.
This article examines the economic indicators that help anticipate rail freight demand shifts, especially across heavy-haul corridors, intermodal networks, and industrial freight systems.
Economic Indicators and Rail Freight Demand Basics
Rail freight demand reflects the volume, distance, commodity mix, and timing of cargo moved by rail networks.
It is shaped by macroeconomic activity, industrial production, energy consumption, port throughput, and inland distribution patterns.
Economic indicators are measurable data points that show whether these underlying activities are expanding, slowing, or restructuring.
In rail freight analysis, economic indicators are useful because trains serve large-volume, asset-intensive, and schedule-sensitive cargo flows.
A single change in steel output, grain exports, coal generation, or container imports can affect locomotive demand and wagon allocation.
Unlike spot trucking markets, rail freight responds strongly to structural production cycles and infrastructure constraints.
Therefore, economic indicators should be read as a system, not as isolated numbers.
The strongest freight signals usually combine output data, inventory movements, price trends, and transportation utilization.
Core Economic Indicators for Rail Freight Forecasting
Several economic indicators consistently provide early insight into rail freight demand shifts.
Their relevance varies by region, commodity base, and corridor design.
Industrial production is one of the most direct economic indicators for rail freight.
When steel mills, chemical plants, cement producers, and machinery factories increase output, rail demand often strengthens.
This affects inbound raw materials and outbound finished goods.
The Purchasing Managers’ Index is especially valuable because it is timely.
A sustained PMI above 50 usually indicates expanding manufacturing activity.
For rail freight, this can signal higher demand for components, packaging materials, and containerized industrial products.
Trade Flow and Port-Linked Indicators
International trade data is central to demand forecasting for intermodal rail-port systems.
Container imports, export bookings, customs data, and vessel arrivals often lead inland rail movements.
Strong port throughput may increase train paths from maritime gateways to inland terminals.
Weak throughput can reduce railcar turns, terminal dwell pressure, and locomotive deployment needs.
Among trade-related economic indicators, export order indexes deserve close attention.
They often reveal demand changes before official trade statistics are published.
Exchange rates also influence rail freight demand by changing the competitiveness of exporters.
A weaker domestic currency can support outbound agricultural, mineral, and manufactured cargo.
A stronger currency may reduce export volumes while supporting imports and distribution flows.
- Rising container imports can lift inland intermodal rail demand.
- Higher export grain bookings can increase covered hopper requirements.
- Port congestion can shift cargo timing and corridor utilization.
- Trade policy changes can redirect routes and border terminal activity.
Commodity and Energy Market Signals
Commodity markets are among the most powerful economic indicators for heavy-haul railway systems.
Coal, iron ore, grain, fertilizers, petroleum products, and construction aggregates often move in high-volume rail corridors.
Price movements alone do not guarantee higher rail volumes.
However, sustained price levels can influence production incentives, export activity, and stockpiling behavior.
Energy demand is especially important where rail networks serve coal-fired generation, refineries, or bulk fuel terminals.
Electricity consumption, natural gas prices, and fuel inventories may alter coal or petroleum rail flows.
Agricultural indicators also matter in seasonal freight planning.
Crop estimates, rainfall patterns, fertilizer demand, and export inspection data affect hopper car utilization.
For mineral corridors, economic indicators should include mine output, smelter utilization, and seaborne export demand.
These indicators help anticipate whether heavy-haul locomotives and wagons will face expansion or underuse.
Inventory Cycles and Domestic Consumption
Inventory cycles often explain short-term rail freight volatility better than headline GDP figures.
When inventories are low relative to sales, restocking can create sudden intermodal and carload demand.
When inventories are excessive, shipments may slow even if consumer demand remains stable.
Retail sales, warehouse vacancy rates, and e-commerce fulfillment activity can support containerized rail movement.
Construction spending also provides important economic indicators for rail demand.
Growth in housing, roads, energy facilities, and industrial parks increases movement of cement, steel, timber, and aggregates.
Consumer confidence can indirectly affect freight through durable goods demand.
Automobiles, appliances, furniture, and electronics each create upstream material flows and downstream distribution requirements.
The best practice is to compare inventory indicators with transport utilization.
A rising inventory-to-sales ratio and falling trainload data may confirm a destocking phase.
Infrastructure Investment and Policy Indicators
Rail freight demand is not only driven by cargo generation.
It is also shaped by network capacity, terminal readiness, signaling systems, and corridor reliability.
Infrastructure spending is therefore one of the strategic economic indicators for long-term rail demand.
Public investment in ports, dry ports, bridges, tunnels, and electrified freight corridors can unlock latent demand.
Private investment in mines, factories, logistics parks, and energy terminals creates destination-specific cargo flows.
Policy indicators also matter when governments promote low-carbon transport or modal shift from road to rail.
Carbon pricing, fuel taxes, truck weight limits, and border efficiency programs can improve rail competitiveness.
Technical standards influence how quickly demand can be served.
Corridors aligned with UIC, EN, AAR, ETCS, or GSM-R frameworks can support safer, more interoperable freight operations.
Business Value of Reading Economic Indicators Correctly
Interpreting economic indicators correctly improves rail freight planning across assets, corridors, and commercial commitments.
It reduces the risk of over-ordering locomotives, under-sizing terminals, or misjudging maintenance windows.
For rolling stock planning, demand indicators clarify where wagons may be needed by commodity and route.
For infrastructure planning, they help justify track upgrades, siding extensions, yard automation, and signaling investments.
For intermodal systems, economic indicators support forecasts for lift volumes, train frequency, and terminal equipment use.
A strong indicator framework also improves risk assessment.
It separates temporary market noise from structural changes in industrial geography or trade policy.
Typical Demand Scenarios and Indicator Patterns
Rail freight demand shifts usually follow recognizable indicator patterns.
These patterns help distinguish expansion, contraction, redistribution, and modal shift scenarios.
- Industrial expansion: rising PMI, higher power use, stronger raw material shipments.
- Export surge: stronger port loadings, favorable exchange rates, higher commodity prices.
- Destocking phase: weak new orders, high inventories, falling intermodal bookings.
- Infrastructure-led growth: public funding, new terminals, improved corridor capacity.
- Energy transition: declining coal flows, rising metals and equipment movements.
No single scenario applies permanently.
A corridor can lose coal traffic while gaining containerized components for renewable energy projects.
Another corridor can experience weaker imports but stronger grain exports in the same quarter.
This is why economic indicators should be reviewed by commodity, lane, and time horizon.
Practical Guidelines for Indicator-Based Rail Analysis
A disciplined approach improves the reliability of economic indicators in rail freight forecasting.
The process should combine leading indicators, coincident indicators, and lagging confirmation data.
- Define the corridor, commodity group, and service type before selecting indicators.
- Use monthly and quarterly data to avoid overreacting to short disruptions.
- Compare economic indicators with actual carload, ton-kilometer, and terminal data.
- Track policy, weather, labor, and border factors that may distort demand signals.
- Separate cyclical weakness from permanent route or commodity substitution.
Data quality is critical.
Some economic indicators are revised after publication, while others reflect survey sentiment rather than confirmed activity.
Regional differences also matter.
A national industrial index may hide weakness in one freight basin and strength in another.
The most useful forecasts combine macro data with operational evidence.
Train dwell, wagon cycle time, locomotive availability, and terminal lifts validate whether demand is actually changing.
From Data Signals to Freight Strategy
Economic indicators become valuable when they support practical decisions.
For rail systems, that means turning data into capacity plans, asset schedules, and investment priorities.
A useful framework starts with baseline demand, then tests upside and downside cases.
Each case should identify required locomotives, wagons, crew resources, yard capacity, and signaling resilience.
G-RFE’s technical intelligence perspective emphasizes this link between freight economics and railway engineering readiness.
Heavy-haul locomotives, intelligent wagons, CBTC or ETCS systems, and intermodal terminals must match realistic traffic expectations.
The next step is to build a repeatable monitoring dashboard.
It should include economic indicators, operational metrics, commodity data, port activity, and infrastructure milestones.
Such a dashboard enables earlier response to rail freight demand shifts.
It also supports more resilient planning for global corridors, industrial gateways, and low-carbon land transport networks.
In a market shaped by trade volatility and infrastructure transformation, economic indicators remain essential decision tools.
Used carefully, they reveal where rail freight demand is rising, weakening, or changing direction before capacity risks become visible.
Industry Briefing
Get the top 5 industry headlines delivered to your inbox every morning.