
Traction Motor Efficiency in Europe: Key Benchmarks

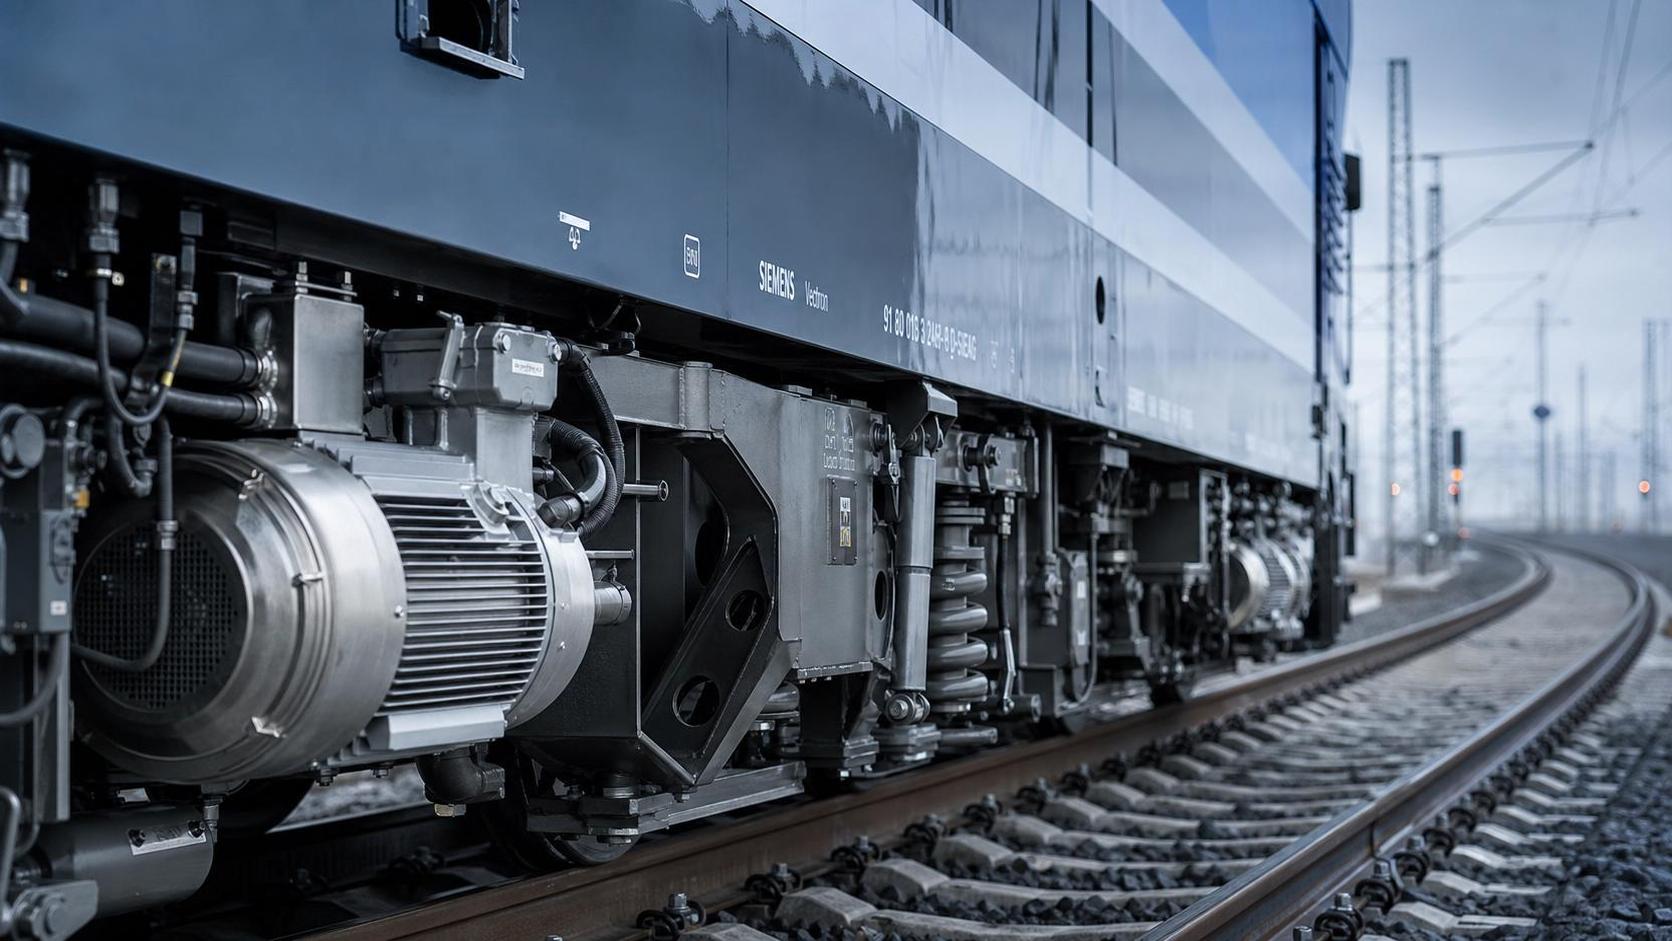
Traction Motor Efficiency in Europe: Key Benchmarks
For rail engineering teams, traction motor efficiency Europe has moved from a supporting metric to a primary evaluation benchmark.
That shift is easy to understand. Freight operators now face tighter energy targets, heavier axle loads, and stricter cross-border compliance demands.
A motor with strong nominal output is no longer enough. The real question is how efficiently it converts electrical input into usable tractive effort across duty cycles.
In practical procurement work, traction motor efficiency Europe affects operating cost, thermal stability, maintenance intervals, and corridor readiness.
It also shapes long-term fleet value. Small efficiency gaps can become major energy and lifecycle differences over millions of train-kilometers.
This article breaks down the main benchmarks, the relevant standards context, and the practical checks that matter before selecting locomotive traction systems.
Why Traction Motor Efficiency Europe Matters More Now
European rail freight is changing quickly. Corridors are expected to carry more tonnage while cutting energy waste and reducing network disruption.
That creates direct pressure on locomotive subsystems, especially traction packages operating under varied gradients, climates, and signaling environments.
Traction motor efficiency Europe matters because motors rarely run at one perfect operating point. They move through start-up, acceleration, cruising, and regenerative braking.
An efficient design keeps losses controlled across those transitions. That supports better energy use, steadier temperature behavior, and more predictable asset performance.
From a fleet planning angle, this also means fewer unpleasant surprises after commissioning. Lab numbers alone do not protect operators from poor real-route efficiency.
More clearly now, buyers want benchmark data that reflects actual freight duty, not just favorable test-window results.
The Core Benchmarks Behind Motor Efficiency Evaluation
When reviewing traction motor efficiency Europe, several indicators should be checked together rather than in isolation.
1. Efficiency Across the Full Operating Curve
Peak efficiency is useful, but not decisive. A locomotive spends limited time at its best-case point.
What matters more is the average efficiency under low-speed haulage, medium-speed pull, and sustained heavy-load operation.
2. Thermal Losses Under Continuous Load
Electrical losses become heat, and heat drives insulation stress, cooling demand, and component aging.
For traction motor efficiency Europe, continuous thermal behavior often says more than a short-duration performance claim.
3. Power Density With Stable Efficiency
Compact motors can support lighter bogie integration and packaging flexibility. Still, power density only helps if efficiency remains stable under stress.
4. Regenerative Braking Recovery
In electrified corridors, energy recovery performance is part of the broader traction efficiency equation.
Recovery rates depend on the motor, inverter, line conditions, and control strategy. Evaluation must reflect the entire traction chain.
Which European Standards Shape the Benchmark
There is no single line item called traction motor efficiency Europe in one isolated document. The benchmark comes from a standards ecosystem.
In real assessments, three reference layers usually matter most: EN requirements, UIC guidance, and operator-specific technical specifications.
EN Standards
EN standards frame the electrical, thermal, environmental, and testing conditions relevant to traction equipment.
They help evaluators compare suppliers on a shared technical basis, especially for temperature rise, insulation class, and operating endurance.
UIC References
UIC frameworks add interoperability and international operating logic. That matters for freight assets crossing multiple networks and terrain profiles.
For traction motor efficiency Europe, UIC alignment supports comparability beyond one country or one rolling stock program.
National and Operator Rules
Local operators often add route-specific requirements on gradients, weather exposure, braking profiles, and maintenance access.
This is where procurement risk often appears. A motor that looks efficient on paper may underperform under local duty assumptions.
Typical Performance Ranges and What They Actually Mean
Published values vary by motor type, cooling method, inverter pairing, and locomotive application.
Still, most traction motor efficiency Europe reviews focus on a few practical interpretation bands rather than one universal number.
These figures are directional, not absolute. Benchmarking only works when duty cycle, traction architecture, and route profile are clearly matched.
What Usually Distorts Traction Motor Efficiency Europe Comparisons
This is where many evaluations become misleading. Not every efficiency claim is directly comparable.
- Different ambient temperatures can change cooling performance and measured losses.
- One supplier may report motor-only efficiency, while another presents inverter-plus-motor system efficiency.
- Test cycles may favor passenger-like duty instead of heavy-haul freight conditions.
- Short tests can hide thermal saturation that appears during long uphill or high-tonnage operation.
- Maintenance assumptions may differ, especially for bearings, cooling channels, and insulation condition.
In actual procurement, traction motor efficiency Europe should always be normalized against identical operating and reporting conditions.
A Practical Evaluation Framework for Technical Selection
A useful review process is structured, simple, and hard to manipulate. The goal is not just to gather numbers, but to expose operational truth.
- Define the freight duty cycle first, including gradients, average speed, tonnage, stop frequency, and seasonal temperature range.
- Request efficiency maps, not one-point values. Ask for low-speed, mid-band, and continuous-load performance.
- Verify thermal test duration and cooling assumptions under EN-aligned conditions.
- Separate motor efficiency from full traction-chain efficiency, then evaluate both.
- Check compatibility with UIC and operator requirements for interoperability and route deployment.
- Model lifecycle energy impact over annual mileage, not just acquisition-stage claims.
This framework works particularly well for corridor programs involving mixed electrification, long freight lengths, and cross-border service plans.
It also supports clearer discussions between railway authorities, locomotive builders, and EPC stakeholders managing system integration risk.
How Efficiency Links to Fleet Value and Engineering Risk
Traction motor efficiency Europe is not only an energy topic. It is a fleet economics and reliability topic as well.
Higher efficiency often reduces heat-related wear, which can improve insulation life and lower unplanned workshop events.
It can also reduce auxiliary cooling demand, which matters when every subsystem competes for onboard energy and maintenance budget.
More importantly, stronger traction motor efficiency Europe benchmarks help prevent under-specification in new freight corridors.
A low-efficiency package may still pass acceptance. But over time, it can raise operating cost, limit route flexibility, and weaken return on capital.
That is why experienced evaluators treat efficiency as a strategic filter, not a late-stage comparison detail.
Final Takeaway for Benchmark-Driven Selection
The most useful view of traction motor efficiency Europe is broad, evidence-based, and route-specific.
Peak percentages alone do not tell the story. Reliable comparison comes from efficiency maps, thermal durability, standards alignment, and lifecycle modeling.
For organizations working across heavy-haul locomotives, rolling stock engineering, signaling-linked operations, and intermodal corridor expansion, that perspective is essential.
At G-RFE, this is exactly where technical intelligence creates value: connecting hardware benchmarks with regulatory context and real freight operating demands.
When traction motor efficiency Europe is evaluated through that lens, decision-making becomes clearer, procurement risk drops, and long-term corridor performance improves.
The next practical step is straightforward: benchmark candidate motors against your actual freight duty cycle before treating any published efficiency figure as decision-ready.
Industry Briefing
Get the top 5 industry headlines delivered to your inbox every morning.