
Railway Suspension Damping Data: How to Judge Ride Stability

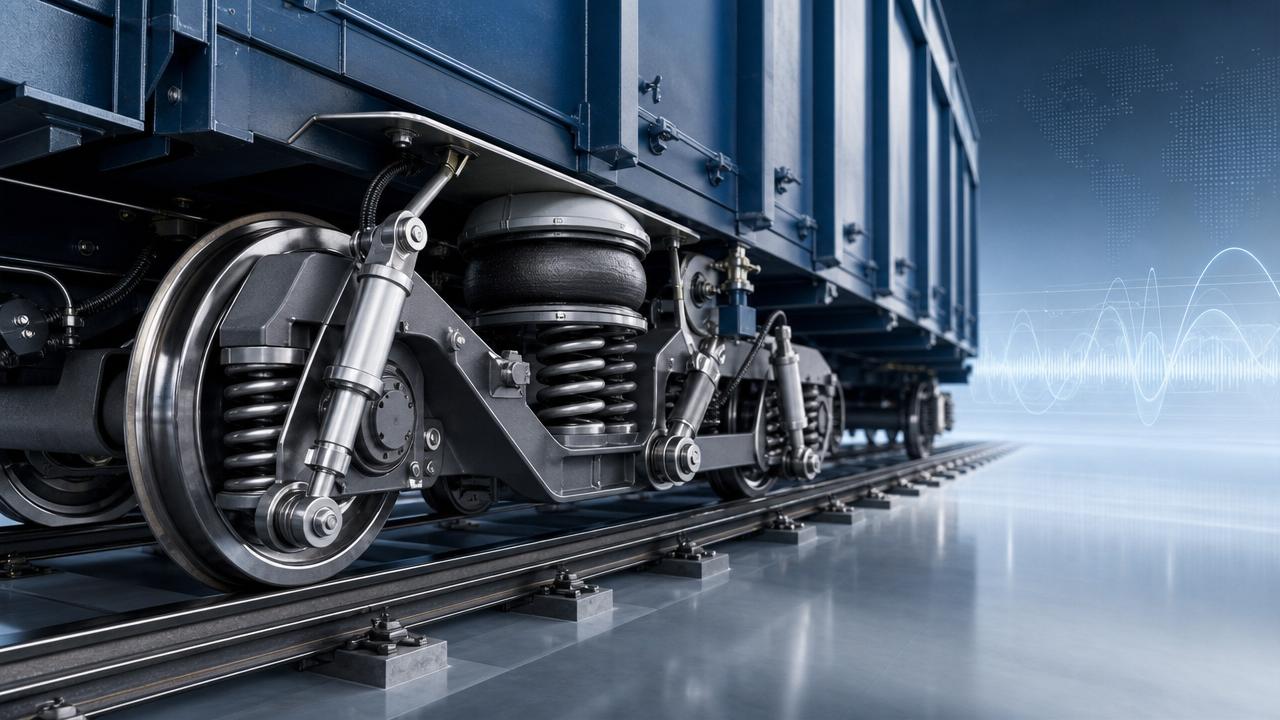
For technical evaluators, railway suspension damping data is more than a test output—it is a direct indicator of ride stability, wheel-rail interaction, and freight safety under real operating loads. By reading damping behavior against dynamic performance standards, teams can quickly identify whether a vehicle supports stable running, reduced vibration, and reliable long-haul service across demanding railway freight corridors.
In heavy-haul and intercontinental freight operations, damping values cannot be reviewed in isolation. They must be linked to axle load, bogie design, track quality, vehicle speed, payload variation, and the signaling-driven operating profile of the corridor.
For evaluators working across locomotive procurement, wagon acceptance, maintenance planning, or engineering benchmarking, the practical question is simple: when does railway suspension damping data indicate a stable vehicle, and when does it reveal hidden dynamic risk?
Why Damping Data Matters in Railway Ride Stability Assessment
Ride stability depends on how effectively the suspension system controls energy from track irregularities, curving forces, hunting motion, and load transfer. In freight applications, even a small mismatch in damping behavior can increase wheel unloading, lateral acceleration, and component fatigue over 500 km to 1,500 km service cycles.
For G-RFE-aligned technical review, railway suspension damping data is usually interpreted together with dynamic indicators such as carbody acceleration, bogie frame response, wheel-rail force variation, and critical speed margin. A damper that appears acceptable on a bench may still underperform in track-based tests.
What the data is actually showing
Most damping records describe force-velocity behavior in compression and rebound. Evaluators often focus on three dimensions: damping coefficient range, curve linearity across low and high piston speeds, and left-right consistency within the same bogie.
Typical review points include low-speed control at 0.05 m/s to 0.10 m/s, mid-range damping at 0.10 m/s to 0.30 m/s, and shock management above 0.30 m/s. These bands help identify whether the suspension can manage both steady vibration and transient impacts.
Primary and secondary suspension implications
Primary suspension damping more directly affects wheelset guidance, wheel-rail force, and bogie hunting behavior. Secondary suspension damping has a stronger impact on carbody comfort, roll control, and load stability, especially in mixed freight with varying center-of-gravity conditions.
- Primary suspension problems often appear as unstable curving, flange contact increase, or wheel unloading.
- Secondary suspension problems often appear as carbody sway, bounce amplification, or poor load protection.
- In heavy-haul systems, both layers must be evaluated together rather than as separate compliance boxes.
The table below shows how evaluators can connect railway suspension damping data to operational ride stability indicators during procurement review, type testing, or maintenance diagnosis.
The key lesson is that a “high” damping force is not automatically better. Stable ride performance usually comes from balanced damping, repeatable force-velocity curves, and controlled energy dissipation across multiple operating speeds rather than a single peak value.
How Technical Evaluators Should Judge Railway Suspension Damping Data
A reliable judgement method starts with test context. The same railway suspension damping data can lead to different conclusions depending on whether the vehicle is a 25 t axle-load freight wagon, a 30 t heavy-haul platform, or a 6,000 hp locomotive operating under cross-border corridor conditions.
Step 1: Confirm test conditions before reading the curve
Review the temperature range, test stroke, excitation frequency, and preconditioning cycles. Damper performance may shift noticeably between 10°C and 40°C, and a unit tested after 3 cycles can behave differently from one stabilized after 20 cycles.
- Check whether the damper was tested in compression and rebound across the same velocity bands.
- Confirm whether values are nominal, peak, or averaged over repeated runs.
- Verify acceptance tolerance, often expressed as ±10% or ±15% depending on design and application.
Step 2: Compare damping behavior with vehicle dynamics targets
Bench data only becomes meaningful when mapped to dynamic acceptance goals. Evaluators should compare the damping profile with the required stability margin below critical hunting speed, carbody acceleration limits, and wheel load reduction thresholds defined by the project or applicable standard set.
For example, if a freight wagon shows acceptable damper force in the lab but still generates elevated lateral vibration near 80 km/h to 100 km/h, the issue may lie in damping distribution, suspension interaction, or worn elastic components rather than nominal force output alone.
Core judgement criteria
- Consistency: pair variation should remain controlled across repeated tests.
- Symmetry: left and right dampers should not create measurable bogie imbalance.
- Usable range: damping should remain effective across empty, partial, and full-load states.
- Durability: performance drift after endurance cycling should remain within project tolerance.
The table below provides a practical screening framework for technical evaluators responsible for acceptance, retrofit, or supplier comparison.
This framework helps teams avoid a common procurement error: approving suspension parts on isolated lab conformity while missing whole-vehicle dynamic incompatibility. In strategic freight corridors, that mistake can increase maintenance events, wheel wear, and route availability risk over a 12 to 24 month operating period.
Common Misreadings, Risk Signals, and Application-Specific Priorities
Technical evaluators often face incomplete datasets, mixed supplier formats, or legacy fleets with inconsistent maintenance records. Under these conditions, railway suspension damping data should be treated as part of a broader engineering decision package rather than a single approval document.
Three common mistakes in damping assessment
The first mistake is focusing only on nominal force values. Two dampers can share similar headline numbers yet differ significantly in hysteresis shape, heat fade, or rebound control. The second is ignoring load-state variation between empty and fully laden wagons. The third is overlooking compatibility with track class and corridor operating profile.
Risk signals that deserve escalation
- Repeated force drift after short service intervals such as 6 to 12 months.
- Noticeable mismatch between bench data and field acceleration records.
- Higher wheel or flange wear appearing on one side of a bogie set.
- Increased wagon sway on long welded track despite acceptable static inspection results.
How priorities change by application
For heavy-haul locomotives, damping assessment often emphasizes hunting stability, traction-induced dynamic load transfer, and high-mass component protection. For freight wagons, the focus shifts toward wheel unloading control, cargo protection, and reduced maintenance cost across high-mileage networks.
In intermodal rail-port systems, where loading patterns can change quickly, evaluators should pay special attention to how the suspension performs across different payload distributions. A system that remains stable within a narrow mass window may not be suitable for multi-service operations.
Implementation Guidance for Procurement, Acceptance, and Maintenance Teams
A good technical decision process turns railway suspension damping data into an actionable acceptance and maintenance workflow. This is especially important for railway authorities, OEMs, EPC contractors, and fleet owners managing cross-border or high-volume freight assets under UIC, EN, or AAR-aligned requirements.
A practical 5-step evaluation workflow
- Define target operating envelope: axle load, design speed, route quality, and payload range.
- Review supplier damping curves and tolerance limits across at least 3 velocity points.
- Compare data with vehicle dynamic simulations or field ride measurements.
- Set incoming inspection and periodic revalidation intervals, often every 12 to 24 months.
- Link findings to maintenance triggers, replacement thresholds, and fleet risk ranking.
What buyers should request from suppliers
Decision-makers should request more than a catalog figure. Useful documentation includes force-velocity curves, tolerance bands, test temperature, endurance drift records, mounting orientation requirements, and evidence of compatibility with the intended bogie or vehicle family.
Where possible, evaluators should also ask for field maintenance guidance. A damper that meets initial acceptance but requires frequent replacement can create hidden life-cycle cost far beyond the purchase price, especially in fleets with 200 to 2,000 vehicles.
For organizations using G-RFE intelligence across rolling stock, infrastructure, and smart signaling interfaces, the strongest approach is integrated assessment. Damping data should support not only mechanical acceptance, but also route reliability, asset availability, and corridor-level freight performance.
If your team is comparing suppliers, validating retrofit options, or reviewing ride stability risk in heavy-haul and intermodal operations, a structured interpretation of railway suspension damping data will shorten technical decisions and reduce operational uncertainty. Contact us to discuss a tailored evaluation framework, request deeper engineering guidance, or explore more railway performance solutions.
Industry Briefing
Get the top 5 industry headlines delivered to your inbox every morning.