
Locomotive Thermal Management Metrics That Cut Downtime

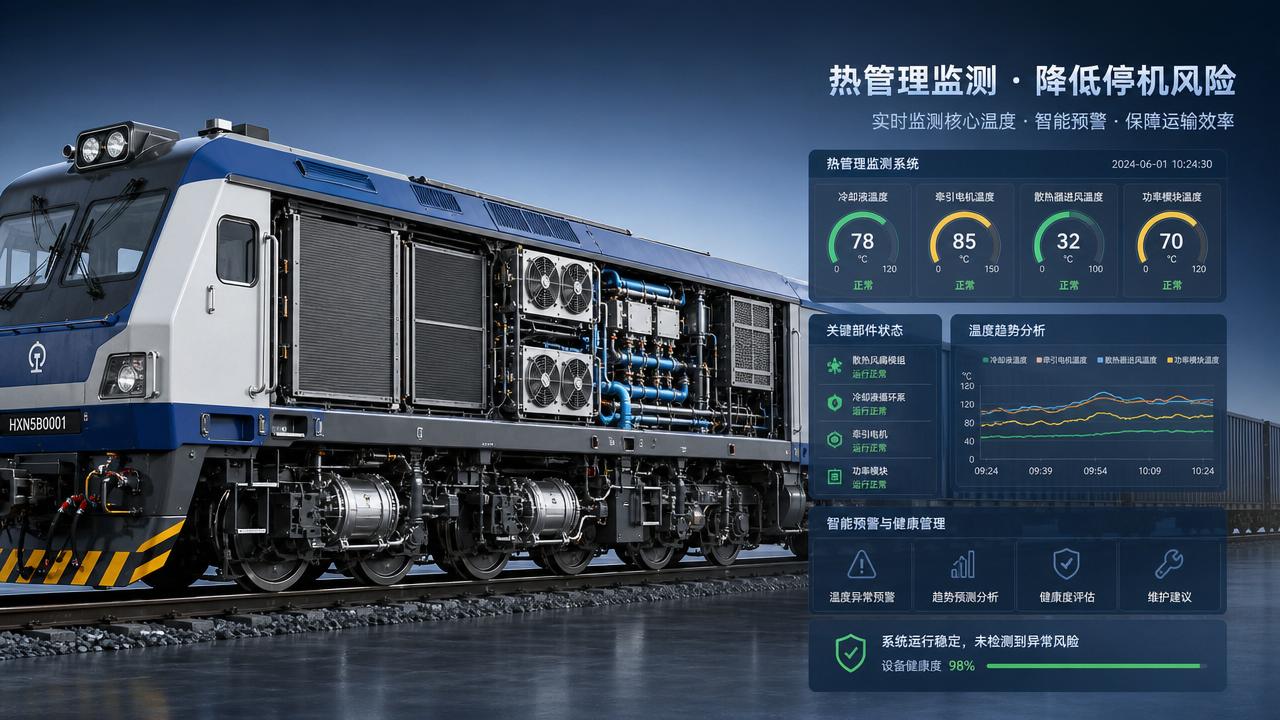
For aftermarket maintenance teams, tracking locomotive thermal management metrics is one of the fastest ways to reduce unplanned stops, protect high-value components, and extend service intervals. From coolant temperature stability to traction motor heat load and radiator efficiency, the right indicators reveal hidden failure risks early and support faster, data-based maintenance decisions across demanding freight operations.
In heavy-haul and intercontinental freight service, thermal issues rarely begin as dramatic failures. More often, they start with a 3°C to 8°C drift in coolant outlet temperature, a rising fan duty cycle, or a repeated hotspot trend in one traction motor.
For maintenance personnel responsible for fleet availability, these small deviations matter. They influence overhaul timing, parts replacement priority, workshop scheduling, and route readiness across locomotives working long duty cycles, high axle loads, and variable ambient conditions.
Within the broader G-RFE technical context, locomotive thermal management metrics also support alignment with UIC, EN, and AAR-oriented maintenance practices. The value is practical: fewer road failures, better asset utilization, and clearer evidence when deciding whether to clean, inspect, repair, derate, or continue operation.
Why locomotive thermal management metrics matter in aftermarket maintenance
Locomotive thermal management metrics are not just engineering values for design teams. In aftermarket service, they are frontline indicators that help maintenance crews identify degradation before it becomes a traction loss event, shutdown alarm, or component burn-through.
A diesel-electric freight locomotive may operate for 16 to 22 hours per day in dust, vibration, and seasonal temperatures ranging from -20°C to 45°C. Under those conditions, cooling system margin can narrow quickly, especially when radiators foul, pumps lose efficiency, or airflow paths are partially blocked.
The cost of missing early thermal signals
When thermal trends are ignored, the failure chain usually expands. A high coolant temperature event can stress cylinder heads and turbocharger performance. Persistent inverter or traction motor overheating can shorten insulation life. Repeated oil temperature excursions can reduce lubrication stability and accelerate wear.
Even a single unplanned stop on a heavy freight corridor can disrupt crew planning, terminal slots, wagon circulation, and maintenance windows. For operators managing 50, 100, or 300-unit fleets, avoiding only a handful of heat-related line failures each quarter can justify stronger monitoring and inspection routines.
Key failure modes connected to heat loading
- Radiator fouling that reduces heat rejection by 10% to 25%
- Coolant pump wear causing unstable circulation at high engine load
- Fan control faults leading to delayed cooling response
- Traction motor hotspot imbalance across bogies or axle positions
- Charge air cooling loss that increases combustion temperature stress
- Lube oil overheating during prolonged grade climbing or low-speed haulage
These issues are especially relevant in freight networks where locomotives experience long idle periods, repeated start-stop cycles in yards, and high tractive demand on gradients. In each case, thermal behavior tells a maintenance story earlier than visual damage alone.
The core metrics maintenance teams should track first
Not every depot needs a complex analytics stack to improve reliability. A focused set of locomotive thermal management metrics can deliver strong maintenance value if the readings are captured consistently, trended over time, and linked to inspection thresholds.
Priority metrics for daily and weekly review
The table below outlines practical thermal indicators that aftermarket teams can use across diesel-electric freight locomotives. The thresholds are typical operating guidance ranges rather than universal limits, because actual values depend on OEM design, route profile, and ambient conditions.
For many fleets, coolant stability and traction motor temperature variance deliver the fastest diagnostic return. If one metric drifts while others remain stable, the problem is often localized. If three or more metrics shift together, the issue may involve airflow, sensor quality, or system-wide thermal loading.
How often should data be reviewed?
A practical rhythm is to review alarm events daily, trend summary data weekly, and perform deeper correlation checks every 30 days. Locomotives assigned to mountain grades, hot-climate routes, or port shuttle work may need a tighter 7-day review cycle.
Useful review intervals
- Per trip: capture peak coolant and traction motor temperatures
- Every 7 days: compare fleet average and outlier units
- Every 30 days: correlate thermal trends with cleaning and repair history
- Every 90 days: reassess threshold settings by route and season
This approach helps teams avoid a common problem: reacting only to alarms. Alarm-based maintenance is too late for many thermal defects. Trend-based maintenance identifies worsening conditions before they become service interruptions.
How to interpret thermal patterns instead of isolated readings
One of the biggest mistakes in using locomotive thermal management metrics is treating each reading as a standalone pass or fail value. In freight operations, the more useful signal often comes from the pattern: rate of change, repeatability, operating context, and comparison with sister units.
Pattern recognition examples for maintenance crews
If coolant temperature rises rapidly during high load but returns to normal at reduced power, the system may still have partial capacity loss. If a traction motor runs 10°C hotter than neighboring motors across five trips, the issue is likely not random weather variation.
Similarly, if fan activation frequency increases by 15% over a two-week period while ambient temperature remains similar, maintenance teams should inspect radiator cleanliness, fan controls, and airflow obstructions before the locomotive enters a high-demand assignment.
A simple decision framework
The table below translates common thermal patterns into likely actions. It is designed for depot-level planning rather than deep OEM engineering diagnosis, making it useful for workshop supervisors, reliability planners, and field service teams.
The key lesson is to link locomotive thermal management metrics with operating context. Gradient, tonnage, ambient heat, idle duration, and trailing load all affect interpretation. Maintenance teams that record context reduce unnecessary parts replacement and improve fault isolation speed.
Building a maintenance workflow around thermal metrics
Good data has limited value without a repeatable response process. Aftermarket organizations need a workflow that converts locomotive thermal management metrics into inspection tasks, labor planning, and release decisions without creating unnecessary workshop delays.
A five-step implementation model
- Define 5 to 8 core thermal indicators for each locomotive class.
- Set normal bands, alert bands, and hold-for-inspection thresholds.
- Review exceptions by trip, by route, and by locomotive number.
- Link each exception type to a standard inspection checklist.
- Feed repair outcomes back into threshold tuning every quarter.
This model works best when thermal data is not isolated from the rest of maintenance records. Pairing heat trends with fan motor current, coolant chemistry checks, filter history, and cleaning frequency creates a more reliable picture of root cause.
Inspection priorities that often deliver quick wins
- Radiator core cleaning after dust season or port-area contamination exposure
- Verification of thermostat opening behavior and pump circulation stability
- Infrared comparison of traction motor end temperatures after run-in
- Inspection of fan blades, shrouds, and control response lag
- Coolant quality checks for concentration, contamination, and scale risk
- Sensor validation before major component removal
In many depots, targeted cleaning and sensor verification solve a meaningful share of recurring thermal alarms. That is why a disciplined workflow usually cuts downtime more effectively than replacing expensive assemblies too early.
What to document after each intervention
Teams should record the pre-repair temperature pattern, the exact maintenance action, and the post-repair result over at least 2 to 3 operating cycles. Without this loop, threshold setting becomes guesswork and repeat faults are harder to classify.
Common mistakes, procurement considerations, and service planning
Aftermarket programs often underperform not because the metrics are wrong, but because the supporting tools, parts strategy, and service process are incomplete. Thermal monitoring needs to be matched by sensible procurement and maintenance planning.
Frequent mistakes in thermal management programs
- Using one threshold for all routes, seasons, and duty profiles
- Ignoring sensor calibration and assuming every alarm is mechanical
- Measuring only peak values and not trend slope or duration
- Replacing motors or pumps before checking airflow and fouling conditions
- Reviewing data monthly when high-utilization fleets need weekly analysis
What buyers and maintenance managers should evaluate
When selecting sensors, inspection services, or cooling system spare packages, teams should compare not just purchase price but also response time, compatibility, calibration support, and field maintainability. In a freight environment, a cheaper component with unstable readings may cost more through false alarms and avoidable downtime.
Useful evaluation dimensions include 4 service factors: lead time for spares, diagnostic clarity, installation complexity, and maintenance interval impact. For critical routes, parts availability within 7 to 15 days can matter more than a modest unit-cost saving.
Where G-RFE-style technical benchmarking adds value
For railway authorities, EPC contractors, and locomotive maintainers operating across mixed standards environments, benchmarking thermal practices against UIC, EN, and AAR-oriented expectations improves consistency. It supports better dialogue between fleet owners, workshops, and engineering suppliers when defining maintenance intervals and inspection scope.
That matters most in cross-border freight corridors, intermodal rail-port systems, and heavy-haul operations where service failures can quickly affect network capacity. A disciplined thermal metric program is not only a maintenance tool; it is part of asset governance and corridor reliability management.
Turning thermal data into fewer delays and longer component life
For aftermarket maintenance teams, the practical value of locomotive thermal management metrics lies in early action. Monitor a focused set of indicators, compare trends by route and unit, and connect each abnormal pattern to a standard inspection response.
When coolant stability, traction motor heat load, oil temperature, and radiator performance are reviewed consistently, maintenance decisions become faster and less reactive. That means fewer line failures, better workshop planning, and more confident control over service intervals in demanding freight operations.
If you are refining fleet maintenance strategy, evaluating monitoring practices, or planning a more robust thermal reliability program for heavy-haul or corridor locomotives, now is the time to act. Contact us to discuss your operating scenario, request a tailored technical framework, or learn more about practical solutions for reducing downtime through better thermal management.
Industry Briefing
Get the top 5 industry headlines delivered to your inbox every morning.